
Edelweiss Business
Cycle Fund
(An open-ended equity scheme following business cycle-based investing theme)
Data as on 31st October, 2025
| Investment Objective : The Fund seeks to generate long-term capital appreciation by investing predominantly in equity and equity related securities with a focus on navigating business cycles through dynamic allocation between various sectors and stocks at different stages of business cycles in the economy. There is no assurance that the investment objective of the Scheme will be achieved. |
|
| Inception Date | 29-Jul-24 |
| Benchmark | NIFTY 500 TRI |
| Fund Managers Details | Mr. Bhavesh Jain Experience: 17 years Managing Since: 29-Jul-24 Mr. Bharat Lahoti Experience: 18 years Managing Since: 29-Jul-24 Overseas Securities: Mr. Amit Vora Experience: 16 years Managing Since: 29-Jul-24 |
| Minimum Investment Amount | Rs. 100/- per application & in multiples of Re. 1/- thereafter. |
| Additional investment amount | Rs. 100/- per application & in multiples of Re. 1/- thereafter. |
| Exit Load |
|
| Total Expense Ratios~: | Regular Plan 2.04% Direct Plan 0.48% |
| Month End AUM |
Rs. 1,772.38 Crore
|
| Monthly Average AUM |
Rs. 1,788.66 Crore
|
| Regular Plan Growth Option |
8.9195 |
| Regular Plan IDCW Option |
8.9195
|
| Direct Plan Growth Option | 9.1058 |
| Direct Plan IDCW Option |
9.1058
|
| ( as on October 31, 2025) |
|
Name of Instrument
|
Industry
|
% to Net
Assets
|
| Equities | 99.68% | |
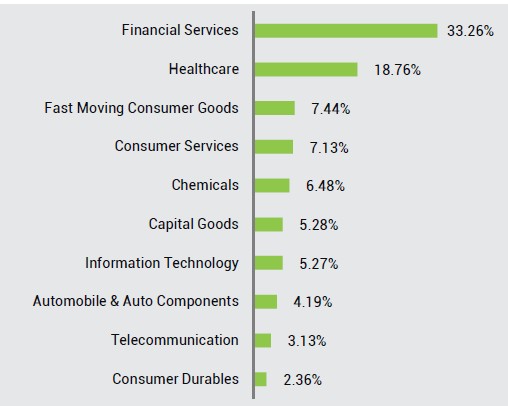
| Muthoot Finance Ltd. | Financial Services | 5.74% |
| Fortis Healthcare Ltd. | Healthcare | 4.79% |
| Divi's Laboratories Ltd. | Healthcare | 4.48% |
| Bosch Ltd. | Automobile & Auto Components | 3.54% |
| GE Vernova T&D India Limited | Capital Goods | 3.42% |
| ICICI Bank Ltd. | Financial Services | 3.41% |
| Coromandel International Ltd. | Chemicals | 2.81% |
| JK Cement Ltd. | Construction Materials | 2.57% |
| HDFC Bank Ltd. | Financial Services | 2.52% |
| Glenmark Pharmaceuticals Ltd. | Healthcare | 2.51% |
| AU Small Finance Bank Ltd. | Financial Services | 2.39% |
| Mankind Pharma Ltd. | Healthcare | 2.29% |
| Premier Energies Ltd. | Capital Goods | 2.19% |
| InterGlobe Aviation Ltd. | Services | 2.17% |
| Max Financial Services Ltd. | Financial Services | 2.13% |
| Coforge Ltd. | Information Technology | 2.12% |
| Solar Industries India Ltd. | Chemicals | 2.04% |
| Max Healthcare Institute Ltd. | Healthcare | 2.03% |
| TVS Motor Company Ltd. | Automobile & Auto Components | 2.00% |
| Hindustan Unilever Ltd. | Fast Moving Consumer Goods | 1.96% |
| Torrent Pharmaceuticals Ltd. | Healthcare | 1.96% |
| Schaeffler India Ltd. | Automobile & Auto Components | 1.85% |
| HDFC Life Insurance Company Ltd. | Financial Services | 1.65% |
| Godfrey Phillips India Ltd. | Fast Moving Consumer Goods | 1.65% |
| Bharti Hexacom Ltd. | Telecommunication | 1.64% |
| Marico Ltd. | Fast Moving Consumer Goods | 1.61% |
| Multi Commodity Exchange Of India Ltd. | Financial Services | 1.49% |
| State Bank of India | Financial Services | 1.49% |
| Abbott India Ltd. | Healthcare | 1.47% |
| FSN E-Commerce Ventures Ltd. | Consumer Services | 1.42% |
| Larsen & Toubro Ltd. | Construction | 1.41% |
| Maruti Suzuki India Ltd. | Automobile & Auto Components | 1.34% |
| Avenue Supermarts Ltd. | Consumer Services | 1.28% |
| Aster DM Healthcare Ltd. | Healthcare | 1.27% |
| Grasim Industries Ltd. | Construction Materials | 1.27% |
| ITC Ltd. | Fast Moving Consumer Goods | 1.25% |
| Cholamandalam Financial Holdings Ltd. | Financial Services | 1.25% |
| Union Bank of India | Financial Services | 1.22% |
| Indian Bank | Financial Services | 1.22% |
| Life Insurance Corporation of India | Financial Services | 1.21% |
| Bharti Airtel Ltd.(Partly paid up) | Telecommunication | 1.20% |
| The Indian Hotels Company Ltd. | Consumer Services | 1.19% |
| Affle 3i Ltd. | Information Technology | 1.15% |
| Bharti Airtel Ltd. | Telecommunication | 1.14% |
| Zydus Lifesciences Ltd. | Healthcare | 1.06% |
| SRF Ltd. | Chemicals | 1.01% |
| Biocon Ltd. | Healthcare | 0.96% |
| GlaxoSmithKline Pharmaceuticals Ltd. | Healthcare | 0.96% |
| UPL Ltd. | Chemicals | 0.91% |
| Radico Khaitan Ltd. | Fast Moving Consumer Goods | 0.86% |
| PNB Housing Finance Ltd. | Financial Services | 0.82% |
| Amber Enterprises India Ltd. | Consumer Durables | 0.81% |
| Hitachi Energy India Ltd. | Capital Goods | 0.79% |
| Jindal Stainless Ltd. | Metals & Mining | 0.75% |
| Cash & Other Receivables | 3.12% | |
| Cash & Cash Equivalent | 1.93% | |
| TREPS_RED_03.11.2025 | 1.19% | |
| Debt | 0.56% | |
| Government of India | SOV | 0.56% |
| Grand Total | 103.36% |
|
Total stocks
in portfolio |
54 |
Top 10 stocks |
35.78% |
|
Active
Share |
77.57% |
|
Net Equity |
99.68% |
| Portfolio Turnover Ratio^ | Equity 2.35 F&O 0.00 |
| Total Portfolio Turnover Ratio^ | 2.35 |
| ^Lower of sales or purchase divided by average AUM for last rolling 12 months. Active share is the fraction of a fund’s portfolio holdings that deviate from the benchmark index. Source: Bloomberg |
|
|
Period
|
Scheme - Regular Plan |
Benchmark (Nifty 500 TRI) |
Additional Benchmark (Nifty 50 TR Index) |
|||
|
Returns* |
Value of Rs. 10000 Invested |
Returns* |
Value of Rs. 10000 Invested |
Returns* |
Value of Rs. 10000 Invested |
|
|
1 Year |
-4.94% |
9,506 |
5.56% |
10,556 |
7.59% |
10,759 |
|
Since Inception - Regular Plan |
-8.69% |
8,920 |
2.10% |
10,264 |
4.12% |
10,520 |
*Greater than 1 year returns are CAGR
Notes:
1.The scheme is currently managed by Mr. Bharat Lahoti (managing this fund from July 29, 2024). & Mr. Bhavesh Jain (managing this fund from July 29, 2024). & Overseas Fund
Manager: Mr. Amit Vora (managing this fund from July 29, 2024) Please Click here for name of the other
schemes currently managed by the Fund
Managers and relevant scheme for performance.
2. For performance of Direct Plan please refer
This Product is suitable for investors who are seeking*:
- Long term capital appreciation
- Investment in equity and equity related instruments with a focus on navigating business cycles through dynamic allocation between various sectors and stocks at different stages of business cycles in the economy.
*Investors should consult their financial advisers if in doubt about whether the product is suitable for them.

Benchmark Riskometer: Nifty 500 TRI
