
Nifty Next 50 Index Fund
An Open-ended Equity Scheme replicating Nifty Next 50 Index
Data as on 31st October, 2025
| Investment Objective : The investment objective of the scheme is to provide returns before expenses that closely correspond to the total returns of the Nifty Next 50 Index subject to tracking errors. However, there is no assurance that the investment objective of the Scheme will be realized and the Scheme does not assure or guarantee any returns. |
|
| Inception Date | 30-Nov-2022 |
| Benchmark | Nifty Next 50 TRI |
| Fund Managers Details | Mr. Bhavesh Jain Experience 17 years Managing Since 30-Nov-2022 |
| Additional investment amount | Minimum of Rs. 100/- and multiples of Re. 1/- thereafter |
| Minimum Investment Amount | Minimum of Rs. 100/- and multiples of Re. 1/-‐ thereafter. |
| Exit Load | NIL |
| Total Expense Ratios~: | Regular Plan 0.74% Direct Plan 0.08% |
| Month End AUM |
Rs. 174.15 Crore
|
| Monthly Average AUM |
Rs. 169.74 Crore
|
Regular Plan - Growth |
15.8776 |
Regular Plan - IDCW |
15.8775 |
|
Direct Plan - Growth
|
16.2174
|
|
Direct Plan - IDCW
|
16.2170
|
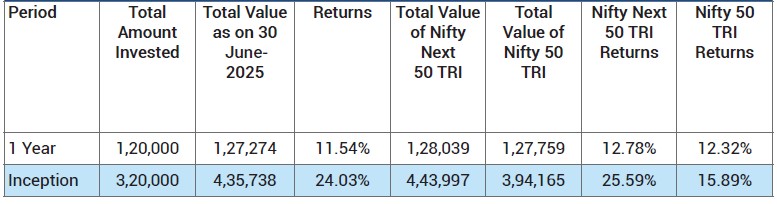
| (as on October 31, 2025) |
|
Period
|
Scheme - Edelweiss Nifty Next
50 Index Fund |
Benchmark (Nifty Next 50 TR Index) |
Additional Benchmark (Nifty 50 TR Index) |
|||
|
Returns |
Value of Rs. 10000 Invested |
Returns |
Value of Rs. 10000 Invested |
Returns |
Value of Rs. 10000 Invested |
|
|
1 Year |
-0.11% |
9,989 |
0.84% |
10,084 |
7.59% |
10,759 |
|
Since Inception - Regular Plan |
17.15% |
15,878 |
18.29% |
16,331 |
12.73% |
14,189 |
Past performance may or may not be sustained in future and
should not be used as a basis for comparison with other investments.
Notes:
1. The scheme is currently managed by Bhavesh Jain (managing this fund from November 30, 2022 ). Please Click here
for name of the
other schemes currently managed by the Fund Managers and relevant scheme for performance.
2. For performance of Direct Plan please
click here
|
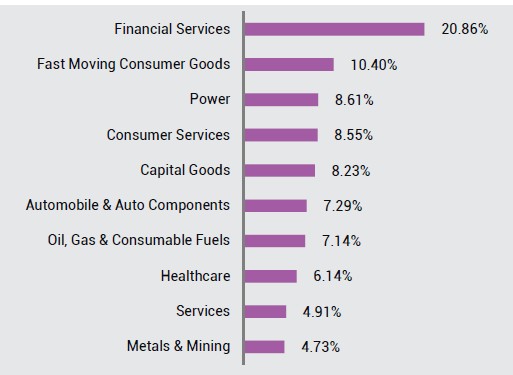
Name of Instrument
|
Industry
|
% to Net Assets
|
| Equities | 99.95% | |
| HINDUSTAN AERONAUTICS LIMITED | Capital Goods | 3.80% |
| DIVI'S LABORATORIES LTD | Healthcare | 3.67% |
| VEDANTA LTD | Metals & Mining | 3.59% |
| TVS MOTOR COMPANY LTD | Automobile & Auto Components | 3.53% |
| CHOLAMANDALAM INVESTMENT & FIN CO. LTD | Financial Services | 3.06% |
| BHARAT PETROLEUM CORPORATION LTD | Oil, Gas & Consumable Fuels | 2.96% |
| BRITANNIA INDUSTRIES LTD | Fast Moving Consumer Goods | 2.95% |
| TATA POWER CO. LTD | Power | 2.91% |
| INDIAN HOTELS CO. LTD | Consumer Services | 2.79% |
| VARUN BEVERAGES LTD. | Fast Moving Consumer Goods | 2.73% |
| ADANI POWER LTD | Power | 2.66% |
| INDIAN OIL CORPORATION LTD | Oil, Gas & Consumable Fuels | 2.65% |
| AVENUE SUPERMARTS LTD | Consumer Services | 2.62% |
| POWER FINANCE CORPORATION LTD | Financial Services | 2.51% |
| INFO EDGE (INDIA) LIMITED | Consumer Services | 2.29% |
| BAJAJ HOLDINGS & INVESTMENT LTD | Financial Services | 2.28% |
| LTIMINDTREE LTD | Information Technology | 2.26% |
| BANK OF BARODA | Financial Services | 2.20% |
| CG POWER AND INDUSTRIAL SOLUTIONS LTD | Capital Goods | 2.17% |
| GAIL (INDIA) LTD | Oil, Gas & Consumable Fuels | 2.11% |
| DLF LTD | Realty | 2.08% |
| ICICI LOMBARD GENERAL INSURANCE CO LTD | Financial Services | 2.06% |
| REC LTD | Financial Services | 2.01% |
| SAMVARDHANA MOTHERSON INTERNATIONAL LTD | Automobile & Auto Components | 2.00% |
| CANARA BANK | Financial Services | 1.98% |
| GODREJ CONSUMER PRODUCTS LTD | Fast Moving Consumer Goods | 1.93% |
| PIDILITE INDUSTRIES LTD | Chemicals | 1.92% |
| PUNJAB NATIONAL BANK | Financial Services | 1.81% |
| UNITED SPIRITS LTD | Fast Moving Consumer Goods | 1.81% |
| JINDAL STEEL LIMITED | Metals & Mining | 1.71% |
| SHREE CEMENT LTD | Construction Materials | 1.62% |
| HAVELLS INDIA LTD | Consumer Durables | 1.61% |
| TORRENT PHARMACEUTICALS LTD | Healthcare | 1.59% |
| AMBUJA CEMENTS LTD | Construction Materials | 1.52% |
| HYUNDAI MOTOR INDIA LIMITED | Automobile & Auto Components | 1.49% |
| ADANI GREEN ENERGY LTD | Power | 1.49% |
| ADANI ENERGY SOLUTION LTD | Power | 1.47% |
| SOLAR INDUSTRIES INDIA LTD | Chemicals | 1.45% |
| LODHA DEVELOPERS LTD | Realty | 1.44% |
| BOSCH LTD | Automobile & Auto Components | 1.38% |
| SIEMENS ENERGY INDIA LTD | Capital Goods | 1.21% |
| JSW ENERGY LTD | Power | 1.21% |
| SIEMENS LTD | Capital Goods | 1.17% |
| ABB INDIA LTD | Capital Goods | 1.17% |
| ZYDUS LIFESCIENCES LTD | Healthcare | 1.04% |
| INDIAN RAILWAY FINANCE CORPORATION LTD. | Financial Services | 0.94% |
| MAZAGON DOCK SHIPBUILDERS LTD. | Capital Goods | 0.89% |
| HINDUSTAN ZINC LTD | Metals & Mining | 0.88% |
| LIFE INSURANCE CORPORATION OF INDIA | Financial Services | 0.85% |
| BAJAJ HOUSING FINANCE LIMITED | Financial Services | 0.44% |
| 6% TVS MOTOR CO LTD NCRPS | Automobile & Auto Components | 0.04% |
| Cash & Other Receivables | 0.05% | |
| TREPS_RED_03.11.2025 | 0.14% | |
| Cash & Cash Equivalent | -0.09% | |
| Grand Total | 100.00% |
|
Total stocks
in portfolio
|
50
|
| Top 10 stocks | 32.03% |
| Portfolio Turnover Ratio^ |
0.47
|
|
Tracking Error (Regular)
|
0.19%
|
| Tracking error is annualised and is calculated based on past one year data. ^Lower of sales or purchase divided by average AUM for last rolling 12 months. |
|
Disclaimer of NSE: It is to be distinctly understood that the permission given by NSE should not in any way be deemed or construed that the Scheme Information Document has been cleared or approved by NSE nor does it certify the correctness or completeness of any of the contents of the Scheme Information Document. The investors are advised to refer to the Scheme Information Document for the full text of the 'Disclaimer Clause of NSE'.
This Product is suitable for investors who are seeking*:
- Long term capital appreciation
- Passive Investment in equity and equity related securities replicating the composition of Nifty Next 50 Index, subject to tracking errors
*Investors should consult their financial advisers if in doubt about whether the product is suitable for them.

Benchmark Riskometer: Nifty Next 50 TRI
