
Edelweiss Large & Mid Cap
Fund
An open ended equity scheme investing in both large cap and mid cap stocks
Data as on 31st October, 2025
| Investment Objective : The investment objective of the Scheme is to generate long-term capital appreciation from a diversified portfolio of predominantly Large Cap and Mid Cap equity and equity-related securities However, there can be no assurance that the investment objective of the Scheme will be realised. |
|
| Inception Date | 14-Jun-07 |
| Benchmark | Nifty Large Midcap 250 TR Index |
| Fund Manager Details | Mr. Sumanta Khan, Experience 18 years Managing Since 01-Apr-24 Mr. Trideep Bhattacharya, Experience 25 years Managing Since 01-Oct-21 Mr. Raj Koradia, Experience 7 years Managing Since 01-Aug-24 |
| Minimum Investment Amount | Rs. 100/- per application & in multiples of Re. 1/- thereafter |
| Additional investment amount | Rs. 100/- per application & in multiples of Re. 1/- thereafter |
| Exit Load | • If the units are redeemed / switched out on or
before 90 days from the date of allotment – 1.00% • If the units are redeemed / switched out after 90 days from the date of allotment – Nil |
| Total Expense Ratios~: | Regular Plan 1.84% Direct Plan 0.42% |
| Month End AUM |
Rs. 4,346.75 Crore
|
| Monthly Average AUM |
Rs. 4,276.12 Crore
|
| Regular Plan Growth Option | 88.4930 |
| Regular Plan IDCW Option | 33.7500 |
| Direct Plan Growth Option | 104.5240 |
| Direct Plan IDCW Option | 40.5430 |
| (as on October 31, 2025) |
|
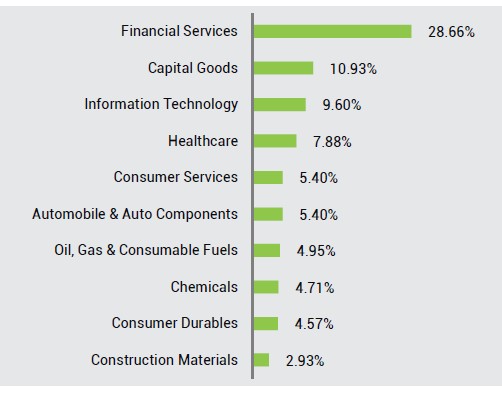
Name of Instrument
|
Industry
|
% to Net
Assets
|
| Equities | 98.05% | |
| HDFC Bank Ltd. | Financial Services | 5.42% |
| Reliance Industries Ltd. | Oil, Gas & Consumable Fuels | 3.13% |
| State Bank of India | Financial Services | 2.11% |
| Infosys Ltd. | Information Technology | 2.00% |
| The Federal Bank Ltd. | Financial Services | 1.98% |
| Bharti Airtel Ltd. | Telecommunication | 1.91% |
| Larsen & Toubro Ltd. | Construction | 1.91% |
| ICICI Bank Ltd. | Financial Services | 1.88% |
| Indian Bank | Financial Services | 1.71% |
| Fortis Healthcare Ltd. | Healthcare | 1.69% |
| Mahindra & Mahindra Ltd. | Automobile & Auto Components | 1.67% |
| ITC Ltd. | Fast Moving Consumer Goods | 1.65% |
| Max Healthcare Institute Ltd. | Healthcare | 1.64% |
| Dixon Technologies (India) Ltd. | Consumer Durables | 1.62% |
| Persistent Systems Ltd. | Information Technology | 1.57% |
| UNO Minda Ltd. | Automobile & Auto Components | 1.51% |
| Eternal Ltd. | Consumer Services | 1.50% |
| Bharat Electronics Ltd. | Capital Goods | 1.46% |
| The Phoenix Mills Ltd. | Realty | 1.46% |
| Cummins India Ltd. | Capital Goods | 1.43% |
| Max Financial Services Ltd. | Financial Services | 1.40% |
| Lupin Ltd. | Healthcare | 1.35% |
| Coforge Ltd. | Information Technology | 1.33% |
| PB Fintech Ltd. | Financial Services | 1.31% |
| Cholamandalam Investment & Fin Co Ltd. | Financial Services | 1.30% |
| Mphasis Ltd. | Information Technology | 1.27% |
| Sundaram Finance Ltd. | Financial Services | 1.25% |
| APL Apollo Tubes Ltd. | Capital Goods | 1.23% |
| Bharat Heavy Electricals Ltd. | Capital Goods | 1.23% |
| Shriram Finance Ltd. | Financial Services | 1.15% |
| TVS Motor Company Ltd. | Automobile & Auto Components | 1.14% |
| Solar Industries India Ltd. | Chemicals | 1.13% |
| Brigade Enterprises Ltd. | Realty | 1.13% |
| Bank of Baroda | Financial Services | 1.09% |
| Coal India Ltd. | Oil, Gas & Consumable Fuels | 1.07% |
| Can Fin Homes Ltd. | Financial Services | 1.06% |
| Multi Commodity Exchange Of India Ltd. | Financial Services | 1.05% |
| Tata Steel Ltd. | Metals & Mining | 1.05% |
| Sun Pharmaceutical Industries Ltd. | Healthcare | 1.05% |
| Muthoot Finance Ltd. | Financial Services | 1.04% |
| Ashok Leyland Ltd. | Capital Goods | 1.00% |
| CG Power and Industrial Solutions Ltd. | Capital Goods | 0.97% |
| KFIN Technologies Ltd. | Financial Services | 0.94% |
| Radico Khaitan Ltd. | Fast Moving Consumer Goods | 0.93% |
| LTIMindtree Ltd. | Information Technology | 0.92% |
| JSW Steel Ltd. | Metals & Mining | 0.91% |
| Aether Industries Ltd. | Chemicals | 0.90% |
| KEI Industries Ltd. | Capital Goods | 0.90% |
| JK Cement Ltd. | Construction Materials | 0.90% |
| JSW Energy Ltd. | Power | 0.89% |
| Bharat Dynamics Ltd. | Capital Goods | 0.89% |
| Tech Mahindra Ltd. | Information Technology | 0.89% |
| Metro Brands Ltd. | Consumer Durables | 0.88% |
| Axis Bank Ltd. | Financial Services | 0.88% |
| Mankind Pharma Ltd. | Healthcare | 0.87% |
| SRF Ltd. | Chemicals | 0.83% |
| Hindalco Industries Ltd. | Metals & Mining | 0.83% |
| NTPC Ltd. | Power | 0.81% |
| Mahindra & Mahindra Financial Serv Ltd. | Financial Services | 0.76% |
| Titan Company Ltd. | Consumer Durables | 0.76% |
| Power Finance Corporation Ltd. | Financial Services | 0.75% |
| Power Mech Projects Ltd. | Construction | 0.74% |
| Hindustan Aeronautics Ltd. | Capital Goods | 0.72% |
| The Indian Hotels Company Ltd. | Consumer Services | 0.71% |
| Cera Sanitaryware Ltd. | Consumer Durables | 0.71% |
| Century Plyboards (India) Ltd. | Consumer Durables | 0.71% |
| Jubilant Foodworks Ltd. | Consumer Services | 0.69% |
| Birlasoft Ltd. | Information Technology | 0.68% |
| IPCA Laboratories Ltd. | Healthcare | 0.65% |
| Trent Ltd. | Consumer Services | 0.65% |
| Ultratech Cement Ltd. | Construction Materials | 0.64% |
| India Shelter Finance Corporation Ltd. | Financial Services | 0.62% |
| Dalmia Bharat Ltd. | Construction Materials | 0.60% |
| Kotak Mahindra Bank Ltd. | Financial Services | 0.60% |
| Samvardhana Motherson International Ltd. | Automobile & Auto Components | 0.59% |
| Vishal Mega Mart Ltd | Consumer Services | 0.56% |
| Bharti Hexacom Ltd. | Telecommunication | 0.51% |
| ITC Hotels Ltd. | Consumer Services | 0.50% |
| L&T Finance Ltd. | Financial Services | 0.50% |
| HCL Technologies Ltd. | Information Technology | 0.49% |
| Divi's Laboratories Ltd. | Healthcare | 0.49% |
| HDFC Asset Management Company Ltd. | Financial Services | 0.48% |
| Schaeffler India Ltd. | Automobile & Auto Components | 0.46% |
| Triveni Turbine Ltd. | Capital Goods | 0.41% |
| Jubilant Ingrevia Ltd. | Chemicals | 0.39% |
| ABB India Ltd. | Capital Goods | 0.39% |
| Titagarh Rail Systems Ltd. | Capital Goods | 0.39% |
| Creditaccess Grameen Ltd. | Financial Services | 0.38% |
| GMM Pfaudler Ltd. | Capital Goods | 0.37% |
| TBO Tek Ltd. | Consumer Services | 0.33% |
| Zensar Technologies Ltd. | Information Technology | 0.29% |
| Cohance Lifesciences Ltd. | Healthcare | 0.26% |
| NTPC Green Energy Ltd. | Power | 0.25% |
| Cash & Other Receivables | 1.95% | |
| TREPS_RED_03.11.2025 | Cash & Cash Equivalent | 2.04% |
| Cash & Cash Equivalent | Cash & Cash Equivalent | -0.09% |
| Debt | 0.00% | |
| Edelweiss Mutual Fund | Mutual Fund | 0.00% |
| Grand Total | 100.00% |
|
Std.deviation
|
13.65%
|
|
Sharpe
Ratio**
|
0.75
|
|
Beta
|
0.97
|
|
Active Share
|
53.75% |
|
Information
Ratio
|
-0.50 |
|
Total stocks in portfolio
|
93
|
|
Top 10 stocks @
|
23.74%
|
|
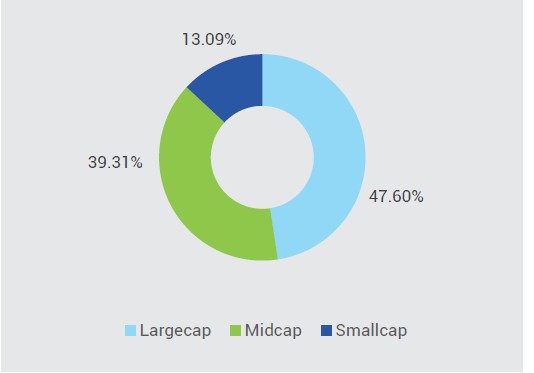
Net Equity
|
98.05%
|
|
Portfolio Turnover Ratio^
|
Equity 0.21
F&O 0.00 |
| Total Portfolio Turnover Ratio^ |
0.21
|
| **Risk free rate of return (FIMMDA Overnight MIBOR )5.69% | @ Top 10 stocks include derivative positions. 1. Standard deviation and Sharpe ratio are annualized. 2. ^ Lower of sales or purchase IDCW by average AUM for last rolling 12 months. 3. Active share is the fraction of a fund's portfolio holdings that deviate from the benchmark index. Source: Bloomberg. 4.Information ratio has been calculated using daily returns over a period of 3 years. |
|
|
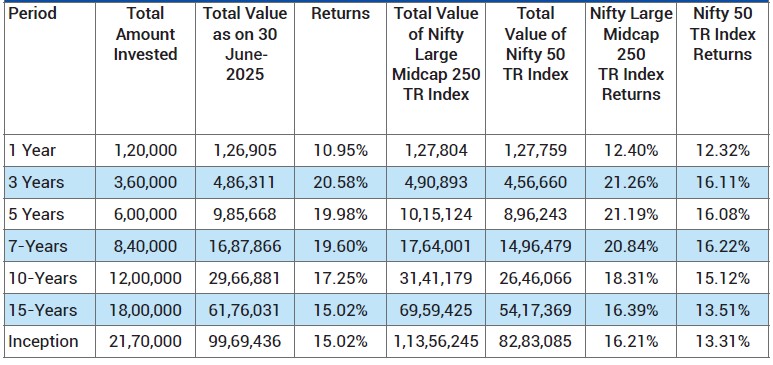
Period
|
Scheme - Regular Plan |
Benchmark (Nifty Large Midcap 250 TR Index) |
Additional Benchmark (Nifty 50 TR Index) |
|||
|
Returns* |
Value of Rs. 10000 Invested |
Returns* |
Value of Rs. 10000 Invested |
Returns* |
Value of Rs. 10000 Invested |
|
|
1 Year |
3.31% |
10,331 |
6.47% |
10,647 |
7.59% |
10,759 |
|
3 Year |
17.35% |
16,169 |
19.00% |
16,860 |
13.90% |
14,781 |
| 5 Year | 21.85% |
26,887 |
23.76% |
29,072 |
18.56% |
23,449 |
| 10 Year | 14.70% |
39,479 |
16.22% |
45,023 |
13.67% |
36,060 |
|
15 Year |
12.86% |
61,479 |
13.79% |
69,581 |
11.50% |
51,284 |
|
Since Inception - Regular Plan |
12.58% |
88,493 |
13.82% |
1,08,246 |
11.72% |
76,751 |
Past performance may or may not be sustained in future and should not be used as a basis for
comparison with other investments. * CAGR Return.
Notes:
1. Different plans shall have different expense structure. The performance details provided herein are
of Regular Plan of Edelweiss Large & Mid Cap Fund.
Returns are for Growth Option only. Since Inception returns are calculated on Rs. 10/- invested at
inception of the scheme. In case the start/end date is non business day, the NAV of previous day is
used for computation.
2.The scheme is currently managed by Mr. Sumanta Khan (managing this fund from April 01, 2024). & Trideep Bhattacharya (managing this fund from 01-Oct-21). & Mr. Raj Koradia (managing this fund from August 01, 2024). Please Click here for name of the other
schemes currently managed by the Fund
Managers and relevant scheme for performance.
3. Please note that the scheme is acquired from JPMorgan mutual fund on and from the close of business
hours of November 25, 2016, hence disclosure requirement vide SEBI Circular no.
SEBI/HO/IMD/DF3/CIR/P/2018/69 dated April 12, 2018 on performance disclosure post consolidation/
Merger of Schemes, prior to acquisition date, is not provided.
For performance of Direct Plan please
click here
This Product is suitable for investors who are seeking*:
- Long-term capital growth.
- Investments predominantly in equity and equity related securities of large & mid cap companies.
*Investors should consult their financial advisers if in doubt about whether the product is suitable for them.

Benchmark Riskometer: Nifty Large Midcap 250 Index TRI
