
Edelweiss Equity Savings Fund
An Open ended scheme investing in equity, arbitrage and debt
Data as on 31st October, 2025
| Investment Objective : The investment objective of the scheme is to provide capital appreciation and income distribution to the investors by using equity and equity related instruments, arbitrage opportunities, and investments in debt and money market instruments. However, there can be no assurance that the investment objective of the Scheme will be realized or that income will be generated and the scheme does not assure or guarantee any returns. |
|
| Inception Date | 13-Oct-14 |
| Benchmark | Nifty Equity Savings Index |
| Fund Managers Details | Equity Portion : |
| Minimum Investment Amount | Rs. 100/- per application and in multiples of Re. 1/- thereafter |
| Additional investment amount | Rs. 100/- per application and in multiples of Re. 1/- thereafter |
| Exit Load |
|
| Total Expense Ratios~: | Regular Plan 1.59% Direct Plan 0.61% |
| Month End AUM |
Rs. 918.76 Crore
|
| Monthly Average AUM |
Rs. 982.84 Crore
|
|
Regular Plan Growth Option
|
25.9199 |
|
Regular Plan IDCW Option
|
17.9143 |
|
Regular Plan Monthly IDCW
Option
|
14.5299 |
|
Direct Plan Growth Option
|
28.6922 |
|
Direct Plan IDCW Option
|
20.8569 |
|
Direct Plan Monthly IDCW Option
|
16.5516 |
| (as on October 31, 2025) |
|
Name of Instrument
|
Industry
|
% to Net Assets
|
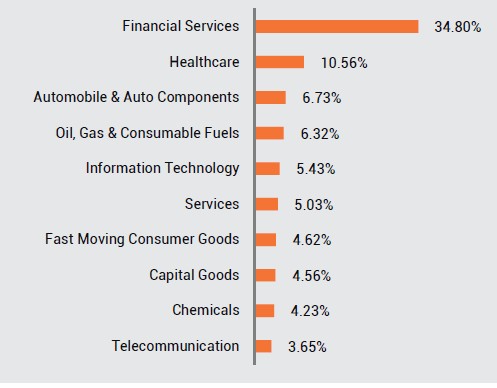
| Equities | 25.06% | |
| HDFC Bank Ltd. | Financial Services | 1.23% |
| Reliance Industries Ltd. | Oil, Gas & Consumable Fuels | 1.18% |
| ICICI Bank Ltd. | Financial Services | 1.02% |
| RBL Bank Ltd. | Financial Services | 1.00% |
| Bajaj Finance Ltd. | Financial Services | 0.73% |
| Aditya Infotech Ltd. | Capital Goods | 0.67% |
| Vikram Solar Ltd. | Capital Goods | 0.67% |
| Medi Assist Healthcare Services Ltd. | Financial Services | 0.65% |
| GK Energy Ltd | Construction | 0.64% |
| Larsen & Toubro Ltd. | Construction | 0.58% |
| Gabriel India Ltd. | Automobile & Auto Components | 0.56% |
| Bharti Airtel Ltd. | Telecommunication | 0.53% |
| HDB Financial Services Ltd. | Financial Services | 0.47% |
| Multi Commodity Exchange Of India Ltd. | Financial Services | 0.45% |
| Anant Raj Ltd. | Realty | 0.44% |
| Indiqube Spaces Ltd. | Services | 0.44% |
| Bharat Electronics Ltd. | Capital Goods | 0.39% |
| Sun Pharmaceutical Industries Ltd. | Healthcare | 0.38% |
| Premier Energies Ltd. | Capital Goods | 0.36% |
| Apollo Hospitals Enterprise Ltd. | Healthcare | 0.33% |
| State Bank of India | Financial Services | 0.32% |
| KFIN Technologies Ltd. | Financial Services | 0.32% |
| Brigade Hotel Ventures Ltd. | Consumer Services | 0.32% |
| Union Bank of India | Financial Services | 0.29% |
| AU Small Finance Bank Ltd. | Financial Services | 0.26% |
| Indian Bank | Financial Services | 0.25% |
| Kotak Mahindra Bank Ltd. | Financial Services | 0.25% |
| The Federal Bank Ltd. | Financial Services | 0.24% |
| Smartworks Coworking Spaces Ltd. | Services | 0.24% |
| Sanathan Textiles Ltd. | Textiles | 0.23% |
| Cipla Ltd. | Healthcare | 0.23% |
| Biocon Ltd. | Healthcare | 0.22% |
| Ellenbarrie Industrial Gases Ltd. | Chemicals | 0.22% |
| HCL Technologies Ltd. | Information Technology | 0.22% |
| Anthem Biosciences Ltd. | Healthcare | 0.21% |
| DAM Capital Advisors Ltd. | Financial Services | 0.21% |
| Hindalco Industries Ltd. | Metals & Mining | 0.21% |
| SJVN Ltd. | Power | 0.21% |
| Hero MotoCorp Ltd. | Automobile & Auto Components | 0.20% |
| TVS Motor Company Ltd. | Automobile & Auto Components | 0.20% |
| International Gemmological Inst Ind Ltd. | Services | 0.20% |
| Pidilite Industries Ltd. | Chemicals | 0.20% |
| Tata Consultancy Services Ltd. | Information Technology | 0.19% |
| Dixon Technologies (India) Ltd. | Consumer Durables | 0.19% |
| ITC Ltd. | Fast Moving Consumer Goods | 0.19% |
| Page Industries Ltd. | Textiles | 0.19% |
| United Spirits Ltd. | Fast Moving Consumer Goods | 0.18% |
| UNO Minda Ltd. | Automobile & Auto Components | 0.18% |
| The Indian Hotels Company Ltd. | Consumer Services | 0.18% |
| Aster DM Healthcare Ltd. | Healthcare | 0.18% |
| Mahindra & Mahindra Ltd. | Automobile & Auto Components | 0.18% |
| VARUN BEVERAGES LIMITED | Fast Moving Consumer Goods | 0.18% |
| Indus Towers Ltd. | Telecommunication | 0.18% |
| Cholamandalam Investment & Fin Co Ltd. | Financial Services | 0.17% |
| Coforge Ltd. | Information Technology | 0.17% |
| Persistent Systems Ltd. | Information Technology | 0.17% |
| InterGlobe Aviation Ltd. | Services | 0.16% |
| Fortis Healthcare Ltd. | Healthcare | 0.16% |
| Zydus Lifesciences Ltd. | Healthcare | 0.16% |
| Max Healthcare Institute Ltd. | Healthcare | 0.16% |
| Punjab National Bank | Financial Services | 0.16% |
| PB Fintech Ltd. | Financial Services | 0.15% |
| Schaeffler India Ltd. | Automobile & Auto Components | 0.15% |
| Cera Sanitaryware Ltd. | Consumer Durables | 0.15% |
| Infosys Ltd. | Information Technology | 0.15% |
| REC Ltd. | Financial Services | 0.15% |
| Urban Company Ltd. | Consumer Services | 0.14% |
| Hindustan Zinc Ltd. | Metals & Mining | 0.14% |
| Ultratech Cement Ltd. | Construction Materials | 0.14% |
| JSW Cement Ltd. | Construction Materials | 0.14% |
| NMDC Ltd. | Metals & Mining | 0.14% |
| HDFC Life Insurance Company Ltd. | Financial Services | 0.13% |
| Housing & Urban Development Corp Ltd. | Financial Services | 0.13% |
| Power Finance Corporation Ltd. | Financial Services | 0.13% |
| Brookfield India Real Estate Trust | Realty | 0.12% |
| Marico Ltd. | Fast Moving Consumer Goods | 0.12% |
| LG Electronics India Ltd. | Consumer Durables | 0.12% |
| Lupin Ltd. | Healthcare | 0.11% |
| Abbott India Ltd. | Healthcare | 0.11% |
| Minda Corporation Ltd. | Automobile & Auto Components | 0.11% |
| CCL Products (India) Ltd. | Fast Moving Consumer Goods | 0.11% |
| Canara Robeco Asset Mgmt Co Ltd. | Financial Services | 0.10% |
| Seshaasai Technologies Ltd. | Financial Services | 0.10% |
| Cholamandalam Financial Holdings Ltd. | Financial Services | 0.10% |
| Axis Bank Ltd. | Financial Services | 0.10% |
| AWFIS Space Solutions Ltd. | Services | 0.10% |
| TBO Tek Ltd. | Consumer Services | 0.09% |
| Aether Industries Ltd. | Chemicals | 0.09% |
| GlaxoSmithKline Pharmaceuticals Ltd. | Healthcare | 0.09% |
| GAIL (India) Ltd. | Oil, Gas & Consumable Fuels | 0.09% |
| Gem Aromatics Ltd. | Chemicals | 0.08% |
| Brigade Enterprises Ltd. | Realty | 0.08% |
| Hindustan Unilever Ltd. | Fast Moving Consumer Goods | 0.07% |
| Mindspace Business Parks Reit | Realty | 0.05% |
| Glenmark Pharmaceuticals Ltd. | Healthcare | 0.01% |
| Debt | 17.81% | |
| Edelweiss Mutual Fund | Mutual Fund | 10.86% |
| Government of India | SOV | 3.53% |
| HDB Financial Services Ltd. | Financial Services | 2.45% |
| National Bk for Agriculture & Rural Dev. | Financial Services | 0.97% |
| Cash & Other Receivables | 16.81% | |
| Cash & Cash Equivalent | 10.17% | |
| TREPS_RED_03.11.2025 | 6.64% | |
| Grand Total | 59.68% |
|
Yield to
maturity (YTM)
#
|
6.20%
|
|
Modified
Duration
#
|
1.13 years
|
|
Average
Maturity
#
|
1.38 years
|
|
Macaulay
Duration #
|
1.20 years
|
|
Std.deviation
|
3.62%
|
|
Sharpe
Ratio**
|
1.41
|
|
Beta
|
0.76
|
|
Active Share |
65.32%
|
|
Total stocks
in portfolio
|
93
|
|
Top 10 stocks
|
8.37%
|
|
Net Equity
|
25.00%
|
Portfolio Turnover Ratio^ |
Equity
0.80 F&O 5.23 Debt 0.25 |
|
Total
Portfolio
Turnover
Ratio^
|
6.29
|
| # Yield to maturity (YTM), Modified Duration, Average Maturity and Macaulay Duration
for Debt Portion. **Risk free rate of return (FIMMDA Overnight MIBOR) 5.69% 1. Active share is the fraction of a fund's portfolio holdings that deviate from the benchmark index. Source: Bloomberg. 2. Standard deviation and Sharpe ratio are annualized. 3. ^ Lower of sales or purchase divided by average AUM for last rolling 12 months. 4. Information ratio has been calculated using monthly returns over a period of 3 years. |
|
|
Period
|
Scheme - Regular Plan |
Benchmark |
Additional Benchmark (CRISIL 10 year Gilt Index) |
|||
|
Returns* |
Value of Rs. 10000 Invested |
Returns* |
Value of Rs. 10000 Invested |
Returns* |
Value of Rs. 10000 Invested |
|
|
1 Year |
8.99% |
10,899 |
7.90% |
10,790 |
7.66% |
10,766 |
|
3 Year |
11.28% |
13,784 |
10.01% |
13,318 |
8.58% |
12,805 |
| 5 Year | 11.00% |
16,860 |
10.62% |
16,577 |
5.21% |
12,892 |
|
10 Year |
9.10% |
23,925 |
9.28% |
24,303 |
6.56% |
18,883 |
|
Since Inception - Regular Plan |
9.00% |
25,920 |
9.06% |
26,089 |
7.07% |
21,280 |
Past performance may or may not be sustained in future and should not be used as a basis for
comparison with other investments. * CAGR Return.
Notes:
1. Different plans shall have different expense structure. The performance details provided herein are of Regular Plan of Edelweiss Equity Savings Fund. Returns are for Growth Option only. Since Inception returns are calculated on Rs. 10/- invested at inception of the scheme. In case the start/end date is non business day, the NAV of previous day is used for computation.
2.The scheme is currently managed by Mr. Bharat Lahoti (managing this fund from September 18, 2017), Mr. Bhavesh Jain (Managing this fund from October 01, 2021) & Mr. Rahul Dedhia
(Managing this fund from July 01, 2024), Ms. Pranavi Kulkarni (managing this fund from August 01, 2024) & Mr. Dhawal Dalal (managing this fund from September 22, 2025). Please refer page for name of the other schemes currently managed by the Fund Managers and relevant scheme for performance.
3. Please note that Edelweiss Equity Savings Advantage Fund was merged with JP Morgan India Equity
Income Fund and feature of JP Morgan India Equity Income Fund was retained with surviving
scheme name as Edelweiss Equity Savings Advantage Fund. Further, performance details as per SEBI
Circular dated April 12, 2018 of JP Morgan schemes prior to acquisition data is not provided.
4. #Please note that benchmark of the Scheme is changed from 70% Crisil Liquid Fund Index + 30% Nifty
50 Index to Nifty Equity Savings Index.
For performance of Direct Plan please
click here
This Product is suitable for investors who are seeking*:
- Income distribution by investing in debt and money
market instrument and arbitrage opportunities.
- Long term capital appreciation by using equity and equity related instruments.
*Investors should consult their financial advisers if in doubt about whether the product is suitable for them.

Benchmark Riskometer: Nifty Equity Savings Index
